
))
Canadian Halloween Data Special
Manage episode 447745621 series 2805499
Контент предоставлен Mean, Median, and Moose. Весь контент подкастов, включая эпизоды, графику и описания подкастов, загружается и предоставляется непосредственно компанией Mean, Median, and Moose или ее партнером по платформе подкастов. Если вы считаете, что кто-то использует вашу работу, защищенную авторским правом, без вашего разрешения, вы можете выполнить процедуру, описанную здесь https://ru.player.fm/legal.
Our first ever Canadian open data Halloween special!
The top 10 films on Netflix leading up to Halloween
Halloween movies are a lot of fun, but are not a big part of the season for our family. I wanted to understand how that compares to other Canadians. There is only one streamer that provides at least some information on the viewing habits of their users, and that provider is Netflix. The top 10 films on Netflix for the week including Halloween and the week before are below. Films that are “Halloween themed” are highlighted in red.
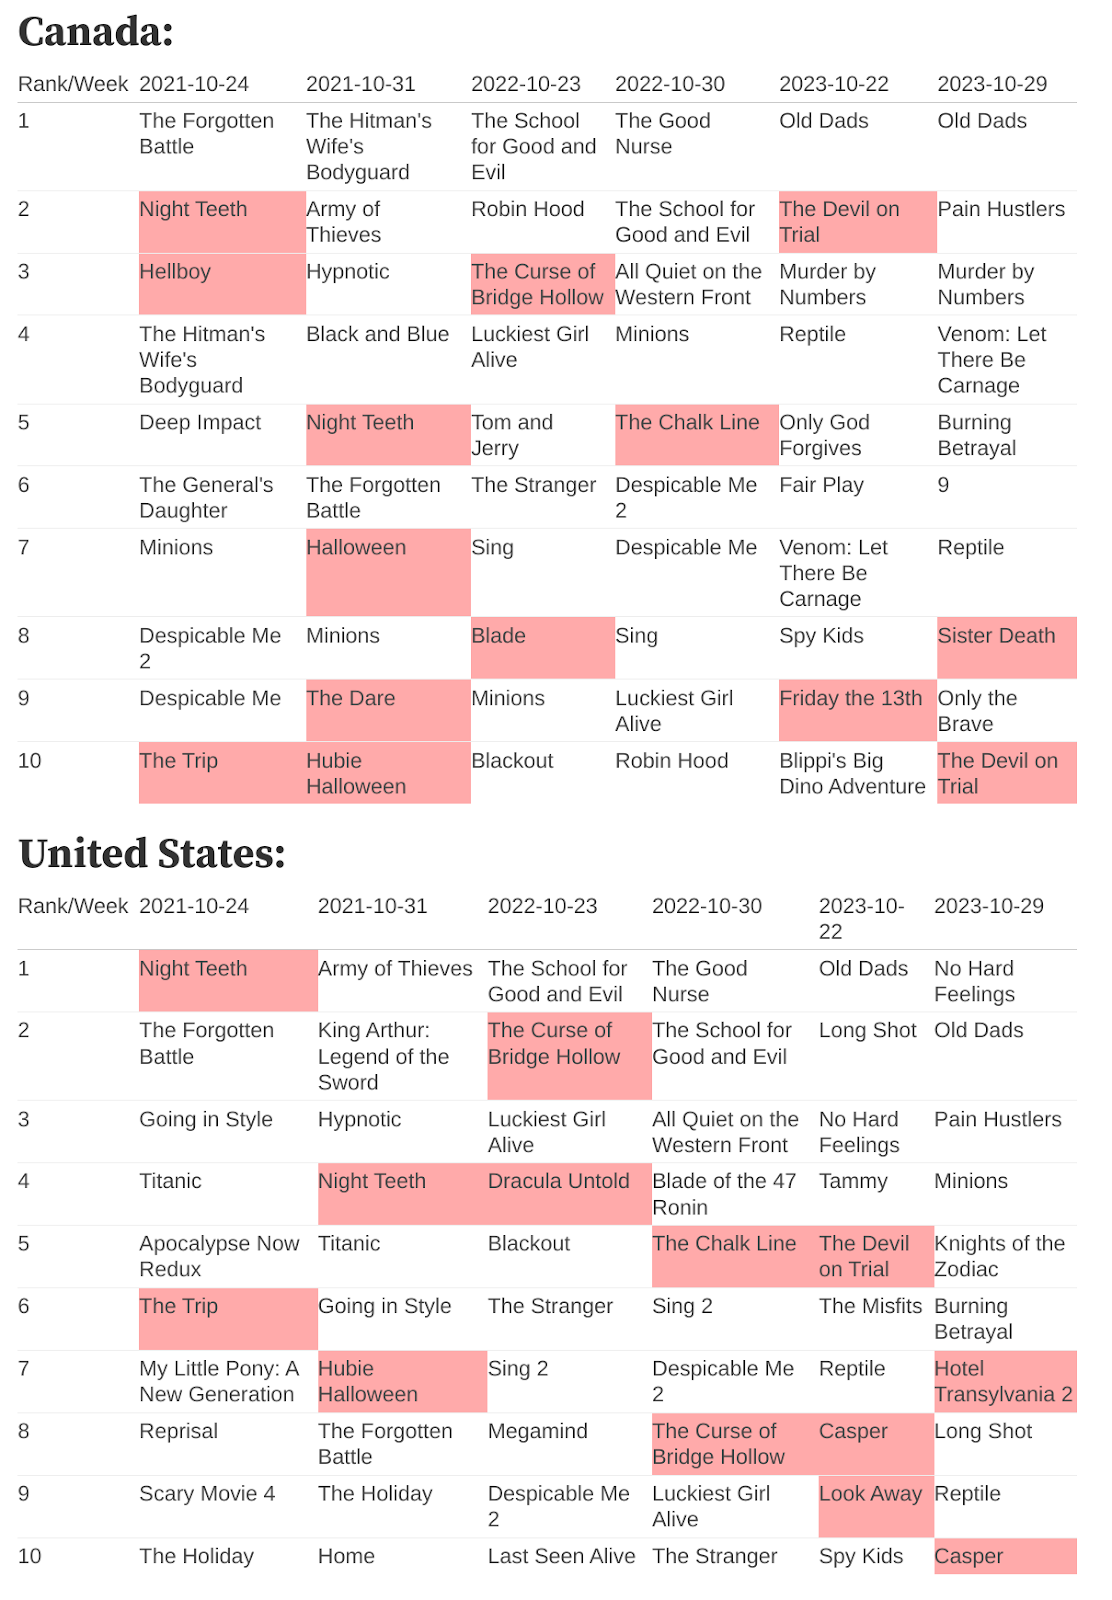
The data only goes back to 2021 because that’s when Netflix started providing it. Halloween themed movies make up between 1 and 4 of the top 10 during these Halloween weeks. It’s hard to compare the US and Canada directly though because other than Netflix originals, the films in the catalog are quite a bit different between the countries. Anyone that has taken a trip to the US and accessed Netflix there can immediately tell.
No film made it to number one except for Night Teeth in 2021 where it took the first place in one of the weeks in 2021. It placed second in Canada where a Dutch film called “The Forgotten Battle” made it to number one. Other high ranking films were “The Curse of Bridge Hollow” and a documentary called “The Devil on Trial”. Interestingly, there are no repeats between years – which isn’t the case for Christmas where titles like “How the Grinch Stole Christmas” repeat.
If you like this kind of data, watch out for Netflix’s “What we Watched” reports that come out every six months or so. These include statistics on all films and TV shows in the Netflix catalog, not just a top 10. Unfortunately it does not have country-by-country breakdowns which makes its usefulness to our podcast limited.
Spooky Szn Maps
Stumbling across Census Mapper’s Halloween-themed maps was a spooky szn treat. Census Mapper is an app developed by software and analytics company Mountain Math’s Data Scientist Jens von Bergmann along with Alejandro Cervantes and makes Canadian census data easily accessible in map format. For every census year since 1996, Census Mapper has produced 3 Halloween-themed maps: Haunted Houses, Trick-or-Treat Density, and Trick-or-Treat Onslaught. Let’s take a look at each of these (and one created by us of course!).
The description on the 2021 Haunted Houses map reads, “Stats Canada calls them ‘dwellings not occupied by usual residents’, we say they are haunted and mapped the percentage of haunted dwellings. If usual residents don’t live there, who does? We think they are haunted by the ghosts of unaffordability and financial impossibilities, so usual residents have fled.” This is a hilariously witty way to describe dwellings occupied solely by foreign residents and/or by temporarily present persons, the latter of which do sound a lot like ghosts…
While Census Mapper notes that “in Vancouver 7% of the housing stock is haunted… and other cities like Calgary, Toronto and Montreal have their fair share, with 5.4%, 7.4%, and 7.1% of housing stock haunted, respectively”, we of course looked at our home region of Windsor-Essex for fun.
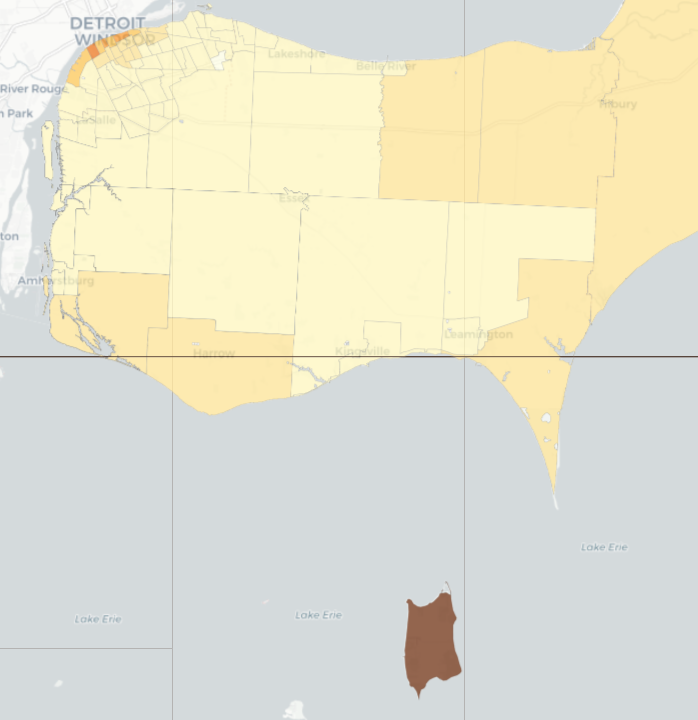
At first glance, not overly haunted, BUT, take a look at that big brown spot – that’s Pelee Island, the southernmost piece of land in Canada, and also, evidently, one of the most haunted, with 67.4% of dwellings not occupied by usual residents! Time for an MMM Halloween field trip to Point Pelee.
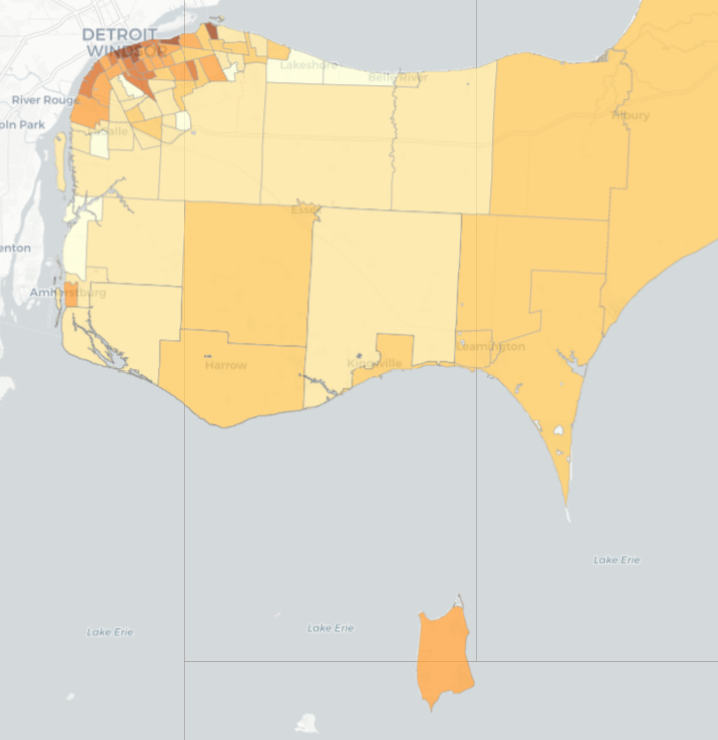
Census Mapper’s Trick-or-Treat Density and Trick-or-Treat Onslaught maps are equally fun. The Trick-or-Treat Density map shows the pockets in a neighbourhood that are likely to get the most trick-or-treater foot traffic, displaying the number of trick-or-treat aged children per km². Census Mapper considers children aged 3 through 14 as being of trick-or-treat age (highly debatable). The Onslaught map helps you stock up on the right amount of candy for trick-or-treaters in your neighbourhood (or more reasonably, helps you hide from the masses of children that might appear on your doorstep) by showing the number of children aged 3 through 14 per doorbell in each area. Census Mapper boasts over 150,000 Canadians use the Onslaught map annually for their Halloween planning!
These maps seemed like a super fun way to visualize Census data, so feeling inspired, we made our own spooky map with Census Mapper – Scary Movie Freakouts. This map shows one-person households as percentage of household types, thereby displaying the areas in Canada down to the DA level with the percentage of folks most likely to have a major freakout after watching a scary movie then navigating the darkness of their home alone. Across Canada, Quebekers might be seeing the most scary movie freakouts with 35.1% of their households being one-person households. Thankfully for those in Nunavut, only 19.7% of households are one-person households. In our home Census Division of Essex, 28% of households are one-person households, including Frazier and Katie’s. If we disappear, you’ll know why!
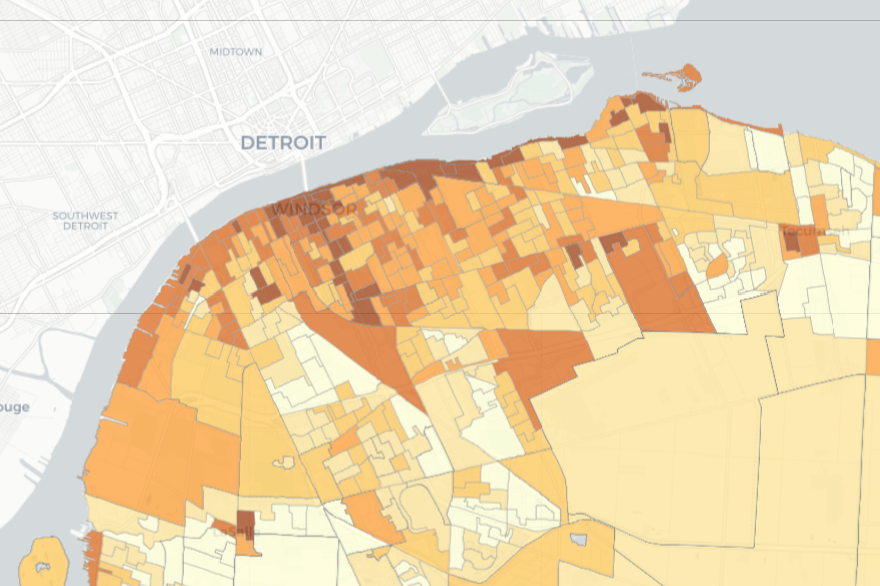
At the more granular DA level in our region, downtown Windsor has the highest cluster of one-person households. Luckily for Pelee Island with its many dwellings not occupied by usual residents, there are likely less major scary movie freakouts happening with 37.5% of households being one-person households. This map should compliment our Netflix Halloween movie roundup well for you scary movie fans who live alone and love the freak out feeling – you’re welcome.
Public Opinion on Halloween
I pulled several public opinion surveys about Halloween to see what polling firms and people are saying about the annual spooky season over the past few years.
First there is a large sample survey over 9,000 Canadians by “Caddle” that was done in partnership with with the Retail Council of Canada (RCC). Second is a survey from Leger from 2023 with 1,521 respondents and 2024 polling that came out just today with a similar poll size. Third is a survey from Ipsos for MARS with 2,000 respondents in 2024 that was released a few weeks ago.
Halloween surveying doesn’t seem to be a regular polling set, sometimes a question gets lumped in with other fall surveys but most of the major polling firms don’t seem to have a annual halloween survey which I kind of find surprising. It is likely they do, they just don’t publish results each year. I did find an older survey from Ipsos from 2020 that was surveying during COVID that said “COVID is the Grinch who stole Halloween”
As a baseline it is interesting as during COVID only about 1 in 5 Canadian households planned to give out candy. Atlantic Canada and the Prairies near 30% while Ontario was at 16% and Quebec with the lowest levels at 13%. In 2023, Leger found that this number was 48% of Canadians and in 2024 at 47%. In 2024 Ipsos found it to be 52%. You can certainly see the impact on the pandemic in the polling on whether or not candy was to be had over time.
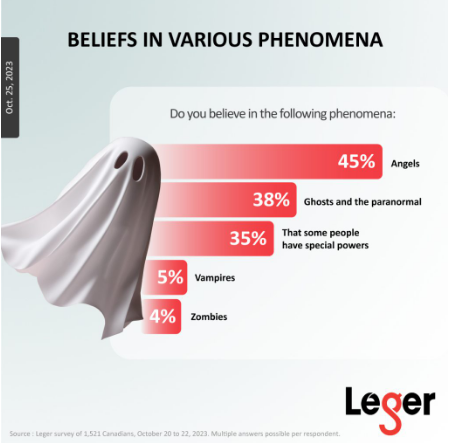
A common question across all of the polls related to whether you were going to spend – more, them or less than compared to last year. Across the 3 polls Canadians planned to spend the same (66% and 71% in 2023, 68% in 2024). Leger went off the board and decided to ask about paranormal activities in their survey finding that:
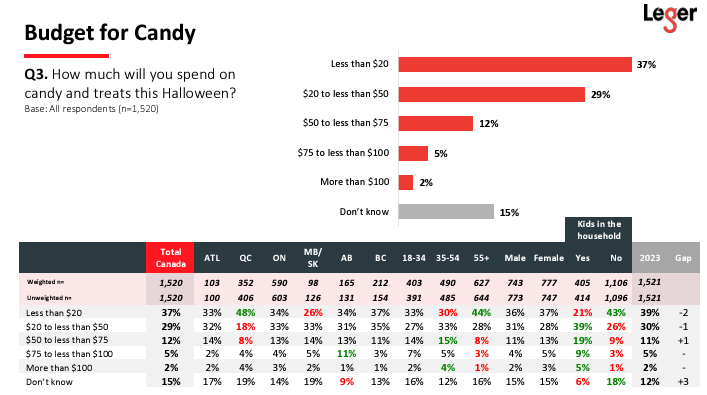
As spending and affordability are top of mind issues in 2024, Leger published a full suite of data asking “How much will you spend on treats and candy this Halloween?
The larger sample Caddle survey was more of an industry focused survey focusing on the spending patterns. Where people planned to buy their candy, how many purchases, when they expect to make them (weeks before Halloween), and how much they plan to spend and on what sort of items.
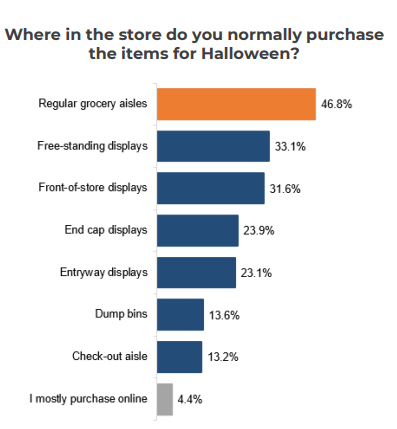
It is interesting that the data from this survey shows that Halloween is a “holiday” that is somewhat online resistant, with Canadians preferring going to stop and also willing to make an extra trip.
The Ipsos survey was interesting as they were able to separate out responses by generational age group.
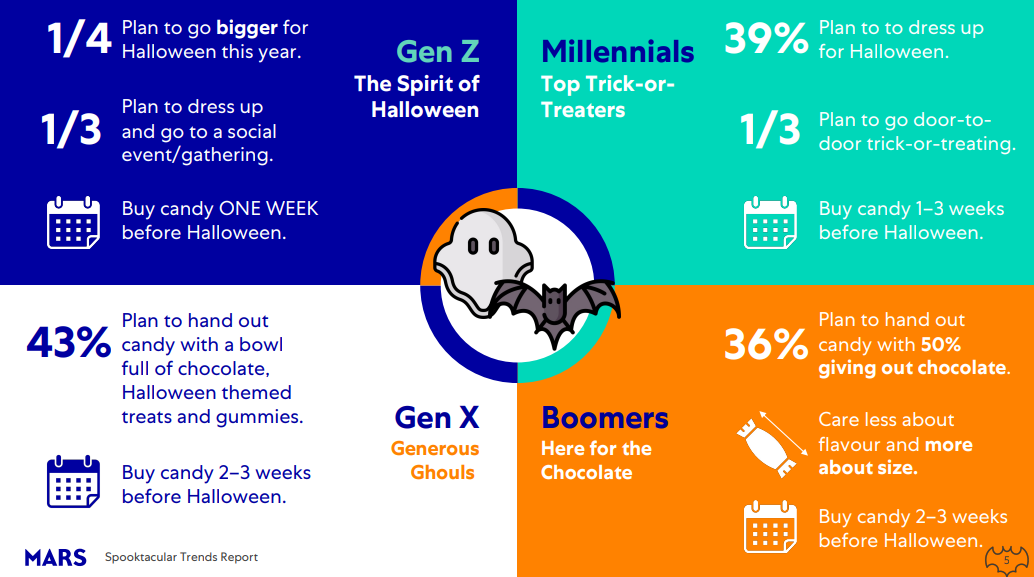
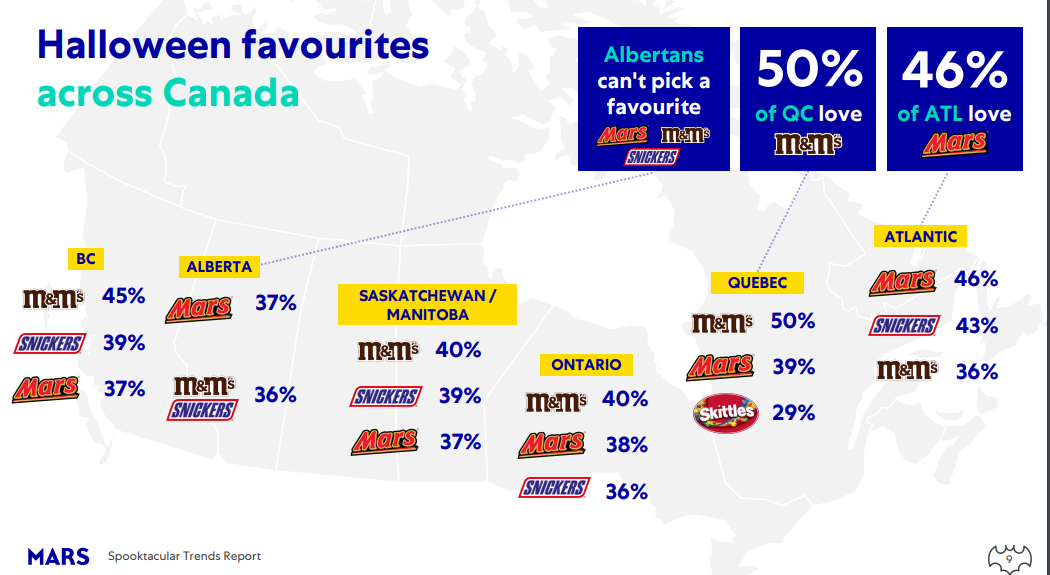
The Ipsos survey in 2024 was funded by MARS so it isn’t surprising that the only candy choices by province/region were MARS brands
Overall the polling is interesting. The consistency in questions across polls and years does provide some interesting insights on Canadian spending patterns and preferences which is a little different that the usual political horse-race that is the usual conversations related to polls. .
Pumpkin Production in Canada
You aren’t ready for spooky season without a jack-o’-lantern. The iconic carved lantern may once have been made from vegetables like rutabagas and turnips, but in Canadian Hallowe’en culture the jack-o’-lantern is universally a pumpkin. With that tenuous connection made, I set out to create a tool for querying and visualizing vegetable production in Canada, with the demo focused specifically on the mighty gourd of October, the pumpkin.
Statistics Canada publishes data about vegetable production in Table 32-10-0365-01, “Area, production and farm gate value of marketed vegetables.” This table is sourced from the Fruits and Vegetables Survey of a random sampling of farms. Data is reported for several measures, grouped by vegetable commodity;
- Area planted
- Area harvested
- Total production
- Marketed production
- Value at the farm gate
That last one requires a bit of explanation – it’s the price of the commodity minus transportation and marketing costs.
These numbers are aggregated at the level of the province and reported annually. Territories aren’t included. Also excluded are institutional farms, community pastures, mushroom and potato farms, and greenhouses.
The table goes back to 1940, but data series for different commodities start at different times. We have pumpkin data from 2007.
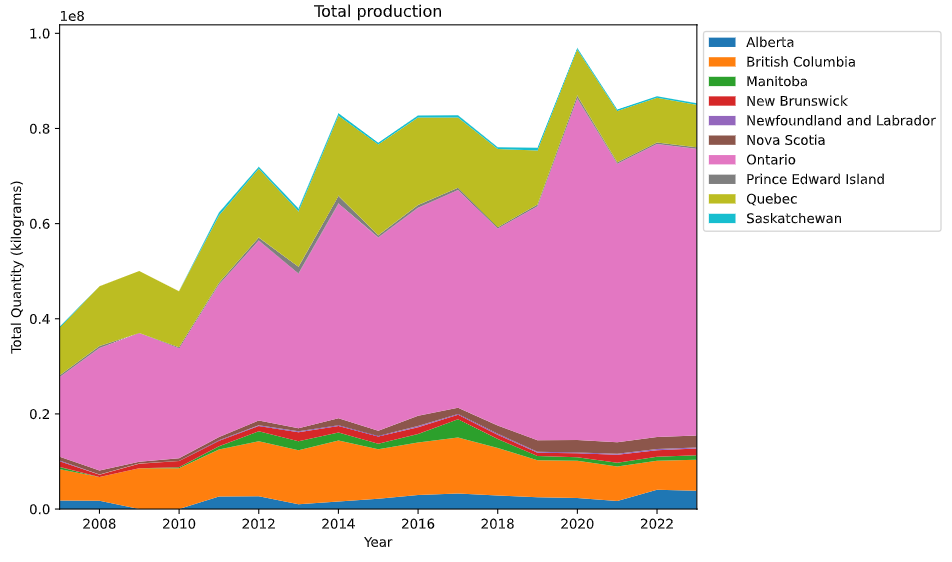
Production volume across Canada has more than doubled since measurement began, and the inflation-adjusted price of a ton of pumpkins is up about 12% since 2007.
When you break it down by province, it’s clear that Ontario is the undisputed pumpkin kingdom of Canada – in most years, Ontario produces more of the orange gourd than the rest of the country combined.
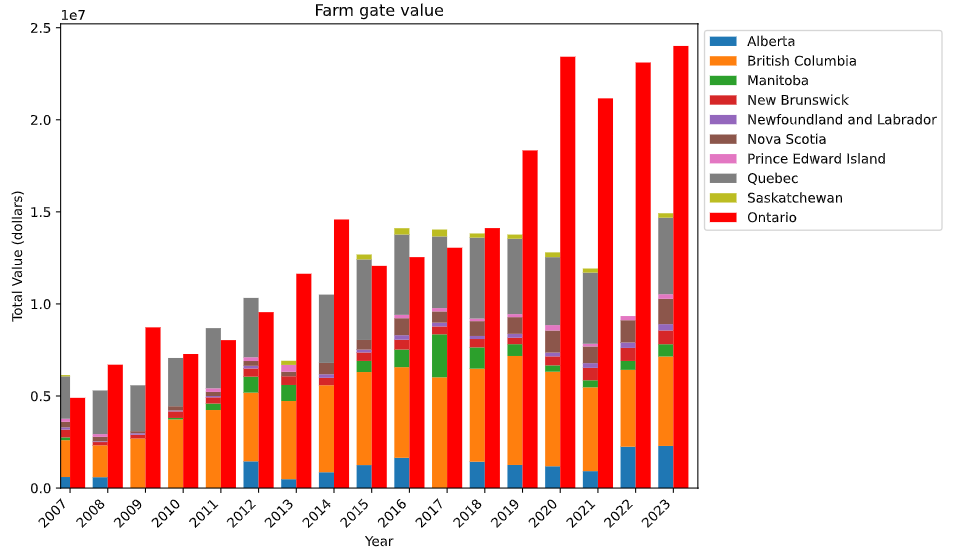
In terms of value to farmers, pumpkin production was worth almost 40 million dollars in 2023. The chart below is not in constant dollars.
You can find all the code, data, and visualizations for this segment on GitHub. I downloaded a CSV from the Statistics Canada table for Canada as a whole, and each province separately, gave them consistent file names and worked with my AI coding assistant to create a Python script to process the data files and generate a SQLite database, and another Python script that uses the matplotlib library to generate interesting charts from the data. The repository comes with a Dockerfile so you can work with the data in a container if you like that sort of thing. Finally, I threw in a few SQL queries to help explore the data.
This repository will work for any commodity in the Fruit and Vegetable Survey if you swap out the data files. The project can pretty easily serve as the starting point for a more comprehensive agriculture data tool.
There are a couple of technical points to talk about with this project.
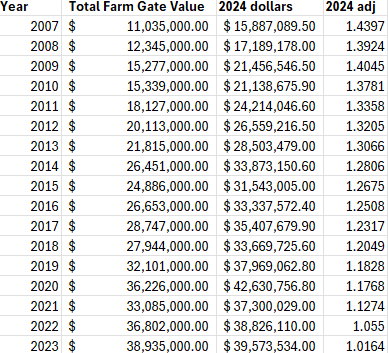
I want to highlight the value and convenience of SQLite for this type of work. It’s fast, stores data efficiently and the database engine is pretty capable. The primary constraint to working with SQLite is that it’s really only good for one user at a time, but that’s no barrier for data analysis work like this. I did some exploring of the data using SQLite and Excel together. This is a really nice approach and I’m glad I tried it. You can paste into Excel directly from SQLite query output by using the Import Text Wizard from the Paste Special menu. That makes it easy to bring in external data for ad-hoc exploration, like this simple table applying a present-day inflation adjustment:
The other point I want to mention is that as I continue to gain experience coding in tandem with LLMs, I learn more and more about the nuances of working with them. LLMs are GREAT at writing Python code but less capable of doing things with a smaller footprint in their training data. Try getting ChatGPT to build an Observable notebook if you want to see what I mean. Which isn’t to say you can’t pair with an LLM for more obscure technology, but you should be prepared to do a lot more oversight of your coding partner and to break your problem into smaller pieces for effective results. Also they’re pretty terrible at debugging, but so are most people so that’s not such a huge insight.
9 эпизодов


